
Research
Website Loading Speed: We Tested 179 Johannesburg Business Sites
We tested the website loading speed of 179 Johannesburg small business sites on a phone. The median took 8.2 seconds to show. Google's mark is 2.5.

Website loading speed decides whether a customer on a phone ever sees your business, so we measured it. On 2 October 2026 we ran Google's own phone speed test on 179 small business websites across Johannesburg: attorneys, vets, plumbers, guest houses and 11 other trades. Most of them weren't a little slow. They missed Google's mark by a wide margin, and one group of sites stood out for a reason their owners probably don't know about. Then there were the websites that didn't open at all.
How fast Johannesburg business websites load in 2026
The typical Johannesburg small business website took 8.2 seconds to show its main content on a phone in our test, more than three times the 2.5 seconds Google calls good. That 8.2 seconds is the median. Half of the 149 working sites were faster and half were slower.
Only 13 of the 149 sites met Google's mark. That's about 9%.
Another 13 landed in the band Google labels "needs improvement", between 2.5 and 4 seconds. The other 123 sites, 83% of them, fell into the band Google calls poor.
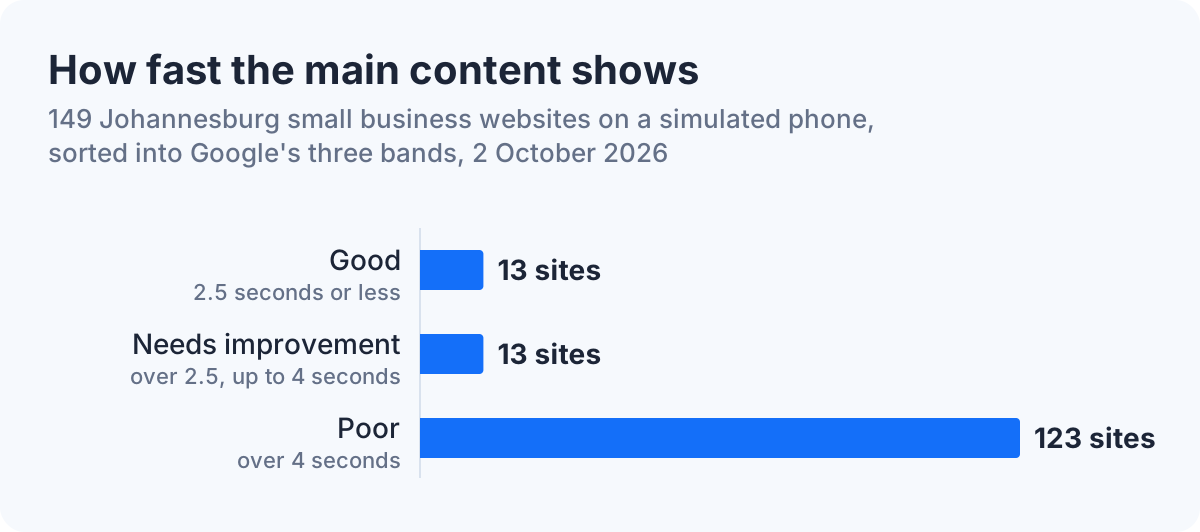
Poor is a generous word for some of them. On 61 sites the main content took longer than 10 seconds to appear, and the slowest needed 42.9 seconds.
Google's overall speed score tells the same story. The median site scored 62 out of 100, and only 14 scored 90 or more.
What is a good website loading speed?
A good website loading speed is main content on screen within 2.5 seconds, according to Google. The measure behind that number is called Largest Contentful Paint, or LCP. Google's web.dev guide says LCP reports the render time of the largest image, text block or video visible on the screen, and sets 2.5 seconds or less as good and more than 4 seconds as poor.
In plain terms, LCP is the moment a visitor can see what the page is about.
Does it affect where you show on Google? Partly. Google's Search documentation tells site owners to "strive to have LCP occur within the first 2.5 seconds of the page starting to load", and says its Core Web Vitals align with what its core ranking systems seek to reward. Speed is one signal among many, though. A slow page with the right answer can still outrank a fast page with the wrong one.
If you'd rather not run a test yourself, you can ask for a free website audit and we'll measure your site on a phone for you.
How we tested 179 websites
We tested the home page of each website once with Google Lighthouse, the open-source tool that also runs the lab test inside Google's PageSpeed Insights, using its standard phone settings. Here's exactly what that means, so you can judge the numbers for yourself.
- Where the list came from. Google Maps business listings in the City of Johannesburg: Johannesburg, Sandton, Randburg, Roodepoort, Midrand and Soweto. We took the first listings returned for 15 trades and kept those with a website of their own.
- What we left out. Franchises, national chains, directories and booking-platform pages. This is a study of small businesses.
- The test. Lighthouse 13.5.0, run from a computer in Johannesburg. Lighthouse simulates a mid-range phone on a slow 4G connection: 1.6 Mbps down, 150 milliseconds of delay and a processor slowed four times, as its throttling documentation sets out. The same document describes that connection as "roughly the bottom 25% of 4G connections and top 25% of 3G connections".
- What we recorded. The speed score, the seconds until the main content showed, the size of the page, what the site was built with, and whether it blocked AI crawlers.
That said, this is a lab test with limits. Each site was tested once, on its home page only. A customer on fibre with a new phone will see your site faster than these figures. The list is the first results Google returned, not a random sample of every business in the city.
We don't name any business here. The point is the pattern.
One in seven listed websites did not work at all
Of the 179 websites listed on those Google Maps profiles, 27 did not work when we tested them, which is about one in seven. A customer who taps "Website" on one of those profiles gets nothing.
The 27 broke down like this:
- 16 gave no answer. We tried each address twice, with and without "www".
- 6 failed to load in the browser.
- 5 showed a placeholder, such as a "coming soon" notice or an empty server page.
Three more sites turned our automated test away. They may work fine for a person, so we left them out of the figures and didn't count them as broken.
That left 149 working websites, and every speed figure in this guide is based on those.
WordPress sites were the slowest group in the test
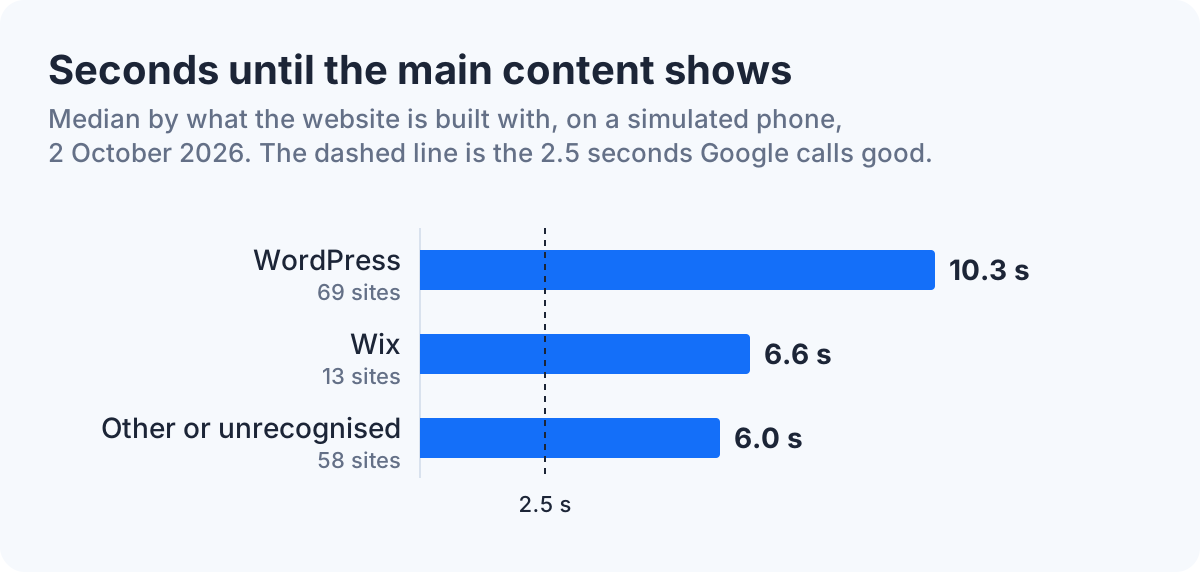
WordPress ran 69 of the 149 working websites, and those 69 took a median 10.3 seconds to show their main content, the slowest of any group. Just one WordPress site out of 69 met Google's 2.5 seconds. On 38 of them the main content took more than 10 seconds.
The other 80 sites did better, though not well. Twelve of them met the mark, and their median was 6.3 seconds. The 13 Wix sites had a median of 6.6 seconds, and none met the mark.
Here's the thing. WordPress isn't slow by law. One WordPress site in our test scored 98 out of 100.
What we can measure is weight. The median WordPress home page in the test weighed 2.4 MB, against 1.4 MB for sites we couldn't match to any site builder. Heavier pages take longer to arrive on a phone. That's a pattern in our sample, not proof of what causes it on any single site.
Our comparison of a static website and WordPress explains where the extra weight tends to come from.
See how your website compares
We test your site on a phone, check where you show on Google and whether AI mentions you, then talk you through it. Free.
Test my website speedWebsite loading speed by trade
Accountants, locksmiths and dentists had the fastest websites in the test, and guest houses, pest control firms and physiotherapists had the slowest. The table lists the 11 trades where we tested at least nine working sites.
| Trade | Sites tested | Median seconds to show main content | Sites meeting 2.5 seconds | Median Google speed score |
|---|---|---|---|---|
| Accountants | 14 | 5.0 | 3 | 68.5 |
| Locksmiths | 12 | 5.3 | 1 | 70 |
| Dentists | 9 | 6.9 | 0 | 63 |
| Attorneys | 11 | 7.2 | 3 | 69 |
| Architects | 15 | 7.5 | 1 | 65 |
| Plumbers and builders | 11 | 8.8 | 0 | 64 |
| Car repair | 9 | 9.2 | 1 | 57 |
| Vets | 13 | 9.4 | 0 | 64 |
| Physiotherapists | 11 | 10.0 | 0 | 61 |
| Pest control and cleaning | 13 | 10.7 | 1 | 60 |
| Guest houses | 10 | 14.1 | 1 | 62 |
Read this table as a rough guide. Nine to 15 sites is a small group, and a few very slow sites can move a trade's median.
Even the fastest trade is twice as slow as Google's mark. No trade came close.
How do I increase my website loading speed?
The surest way to increase your website loading speed is to make each page load less. The 13 sites that met Google's mark had a median page weight of 0.2 MB and made 16 requests for files. The 123 poor sites had a median of 2.0 MB and 75 requests. The heaviest home page we tested weighed 28.4 MB.
Four things help, in order of effort:
- Shrink the pictures. A photo straight from a camera can outweigh the rest of the page. Resize it to the width it's shown at and save it in a modern format such as WebP.
- Remove what you don't use. Sliders, pop-ups, chat widgets and tracking code each add files a phone has to fetch.
- Test again after every change. One removed add-on can do more than a week of fine-tuning.
- Rebuild the site as plain pages. A page that is a ready-made file has almost nothing to load.
We've seen the fourth option work. Raimond rebuilt dcreviews.co.za, a debt counsellor review site, from WordPress as plain pages. In a Lighthouse phone test in September 2026, its main content went from 7.0 seconds to 1.2 seconds, and its speed score from 75 to 100. That's what a website rebuild does: the same look and the same words, with far less to load.
What else the test found: HTTPS, phones and AI crawlers
Almost every working site had the basics right: 144 of 149 used HTTPS, the secure connection shown by a padlock, and 140 were set up to fit a phone screen. Speed, not security, is the common problem.
Two other findings are worth a look.
Half the sites, 74 of 149, carried structured data. Structured data is a set of labels in a page's code that tells Google and AI assistants what the business is, where it is and what it offers. The other half leave that to guesswork.
Only 2 of the 149 sites blocked AI crawlers such as OpenAI's GPTBot in their robots.txt file, the file that tells automated readers what they may open. One of those two blocked every crawler, Google's included. For the rest, AI assistants are free to read the site.
How fast is my website loading?
You can find out how fast your website is loading in about a minute with Google's free PageSpeed Insights tool. It runs the same kind of test we used.
- Open PageSpeed Insights.
- Paste in your website address and press Analyze.
- Choose the Mobile tab.
- Find "Largest Contentful Paint" and compare it with 2.5 seconds.
Your number won't match ours exactly, because Google runs the test from its own computers. The band it lands in is what counts: good, needs improvement or poor.
In practice, though, the number is only the start. What matters is what's making the page heavy and whether it's worth fixing or rebuilding.
Find out where your website stands
Send us your address. We check speed, Google and AI, then call to explain what we found in plain words. Nothing to sign.
Get my free website auditChange your website by sending an email
We rebuild your WordPress site to load fast, then you email changes and approve every one before it goes live. R1 500 a month for the first 6 months, then R750 a month.